



Core Web Vitals often determine which of two otherwise comparable pages outranks the other. Two pages with similar domain authority, comparable backlink profiles, and nearly identical content quality, and yet one consistently outranks the other. If you’ve dug into the gap and can’t explain it through links or content alone, page experience performance is often the deciding factor. Google has confirmed this through Search Central documentation, and CrUX data bears it out.
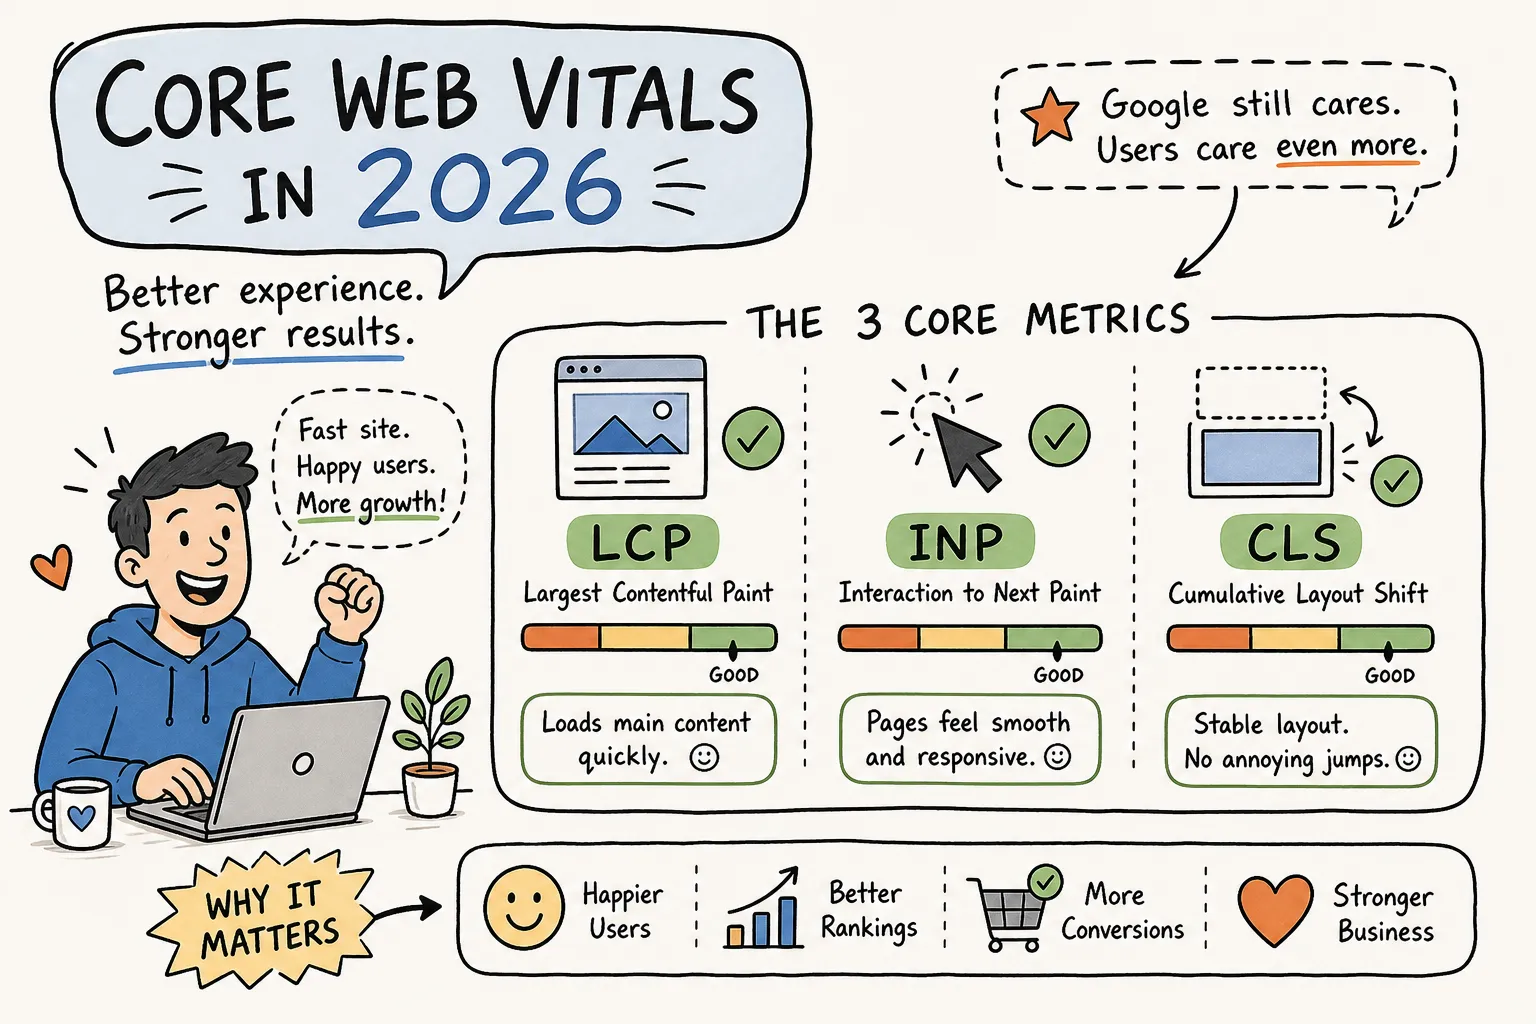
Core Web Vitals are Google’s set of three real-user performance metrics used to evaluate page experience as a search ranking signal. They measure how fast your largest content element loads, how quickly your page responds to every interaction, and how stable your layout stays while it renders. These aren’t suggestions, they’re thresholds with documented ranking consequences.
The technology team at Media Indonesia (mediaindonesia.com/teknologi) has covered the evolution of these metrics from Google’s initial rollout in 2021 through the First Input Delay retirement in 2024 and into the current 2026 standards. This article covers the current definitions, passing thresholds, ranking mechanics, measurement tools, and the benchmarks you need to set realistic targets. The fixes themselves are in the step-by-step optimization guide at mediaindonesia.com/teknologi.
The three metrics that define Core Web Vitals
LCP: how fast your largest content element loads
Largest Contentful Paint measures loading performance. Specifically, it times how long it takes from the moment a user starts navigating to when the largest visible element on screen, typically a hero image or main heading, is fully painted. The “Good” threshold is under 2.5 seconds. Between 2.5 and 4.0 seconds lands in “Needs Improvement,” and anything over 4.0 seconds is rated “Poor.”
LCP is where most sites struggle, particularly on mobile. According to May 2026 CrUX data, only 68.6% of origins globally pass this metric, and mobile pass rates lag further behind, making it the hardest of the three to clear at scale. Slow server response times (Best Scalable Cloud Hosting Solutions in 2026), unoptimized images, and render-blocking resources are the primary culprits.
INP: how quickly your page responds to every click and tap
Interaction to Next Paint measures responsiveness across the entire page session, not just the first interaction. It tracks the latency from any user action, click, tap, or keypress, to the next visible paint on screen. INP replaced First Input Delay (FID) as an official Core Web Vitals metric in March 2024, and the change significantly raised the bar. FID only measured the first interaction; INP measures all of them.
The thresholds: under 200ms is “Good,” 200, 500ms is “Needs Improvement,” and over 500ms is “Poor.” JavaScript-heavy pages running ad scripts, chat widgets, or framework hydration on the main thread are the most common INP failure points. Sites that passed FID comfortably often failed INP for exactly this reason. For a deeper practical walkthrough of moving from understanding to implementation, see The 2026 Ultimate Guide to Core Web Vitals: Achieving a 100/100 Performance Score.
CLS: how stable your layout stays while loading
Cumulative Layout Shift measures visual stability. Unlike LCP and INP, CLS is a unitless score representing how much visible content shifts unexpectedly during load. A score under 0.1 is “Good,” 0.1, 0.25 is “Needs Improvement,” and over 0.25 is “Poor.” Images without explicit dimensions, dynamically injected ads, and late-loading web fonts are the most frequent causes.
CLS has the highest global pass rate at 81.3%, which makes it the most achievable of the three metrics. That said, a high CLS score is genuinely disruptive for users, especially on mobile, and ignoring it still costs you rankings when competing pages have clean scores.
How Google uses Core Web Vitals for search rankings
The tiebreaker role in competitive search results
Core Web Vitals are a confirmed ranking signal, but they function primarily as a tiebreaker. When two pages have comparable content relevance and authority, the one with stronger performance scores gets the edge. Sites with LCP above 2.5 seconds have seen average ranking drops of 2, 4 positions on competitive queries, according to a March 2026 industry analysis. That’s not a minor adjustment on a high-traffic query.
Google evaluates all three metrics at the 75th percentile of page loads over a rolling 28-day window. Your site needs to meet the “Good” threshold for 75% of real user visits, not just on average. That distinction matters: you’re optimizing for the slowest quarter of your audience, not the median.
Why field data determines your rank, not your Lighthouse score
Google ranks sites based on field data from the Chrome User Experience Report (CrUX), not lab scores from Lighthouse or PageSpeed Insights. A perfect Lighthouse score is irrelevant if real users on slower mobile networks experience a 4-second LCP. This is one of the most common misconceptions developers bring into optimization work.
Rankings are also determined primarily by mobile Core Web Vitals scores. Google’s mobile-first indexing means your desktop performance is secondary. If your mobile scores are failing, your rankings are affected regardless of how fast your site loads on broadband desktop.
The AI Overviews connection: a new visibility risk in 2026
Beyond traditional blue-link rankings, there’s a growing correlation between page speed performance and citation in Google’s AI-generated search summaries. Slow sites appear less frequently in AI Overviews, even when their content is directly relevant. Google hasn’t published an explicit speed cutoff, but observed patterns in CrUX data consistently show that pages meeting Core Web Vitals thresholds are cited at higher rates than those that don’t.
Poor performance now carries two forms of visibility risk: it can suppress your traditional ranking and reduce your chances of appearing in AI-generated summaries. In a competitive search landscape, that compounding effect is worth taking seriously. Publishers experimenting with AI-powered content tools can see differences in how their content is surfaced, see examples like The Best AI YouTube Video Summarizers in 2025 for one category of AI tooling and how output formats influence discoverability.
How these metrics have evolved through 2026
From FID to INP: the shift that changed optimization priorities
First Input Delay was easy to pass and easy to game. It only measured the first interaction on a page, which meant a site could score “Good” on FID while still feeling sluggish and unresponsive during normal use. INP fixed that by tracking all interactions throughout the page session and reporting the worst-performing one (excluding outliers).
INP’s promotion to a primary ranking signal, equal in weight to LCP and CLS, was confirmed in a March 18, 2026 Search Central blog post. In practice, JavaScript-heavy sites that thought they were in good shape discovered they weren’t. Pages running multiple third-party scripts or complex framework hydration on the main thread often shifted from “Good” to “Needs Improvement” with this change.
Where the bar stands now, and where it’s heading
Google’s official “Good” thresholds remain LCP under 2.5 seconds, INP under 200ms, and CLS under 0.1. Top-performing sites are already targeting tighter numbers: LCP at or under 2.0 seconds, INP at or under 150ms, and CLS at or under 0.05. These stretch targets represent where competitive advantage actually lives, not just where the penalty stops.
The trajectory since 2021 has been consistent: Google raises expectations over time as the web gets faster. Passing today’s thresholds is necessary, but it’s not a permanent position. Sites that treat performance as ongoing maintenance rather than a one-time project are the ones that stay ahead. For Google’s published guidance on threshold definitions, see defining Core Web Vitals thresholds.
How to measure Core Web Vitals accurately
Field data tools: what real users are actually experiencing
Google Search Console shows your Core Web Vitals report using 28-day field data aggregated by page group. This is what Google sees when evaluating your site, making it the most important report to check first. PageSpeed Insights combines both: the top section shows field data from CrUX, while the bottom section runs a real-time Lighthouse lab test. The Chrome UX Report (CrUX) is the underlying data source for both tools, updated monthly from real Chrome user sessions (CrUX release notes).
Field data tells you what’s actually happening for your users. When your Search Console report shows an LCP of 3.1 seconds, that means 25% of real visitors are waiting longer than 3.1 seconds for your main content to appear. That’s the population you’re optimizing for.
Lab data tools: for diagnosing and testing fixes
Lighthouse (run via Chrome DevTools or PageSpeed Insights) gives you a controlled, reproducible test with specific recommendations on what to fix. The Chrome DevTools Performance panel lets you record and inspect long tasks, layout shifts, and interaction delays at the code level. Lab data is where you go after field data identifies a problem.
The diagnostic workflow: check field data first to confirm there’s a real problem affecting real users, then use lab tools to find the specific cause and validate your fix before deploying. Don’t start with Lighthouse and assume its recommendations match what your users experience. Field data leads; lab data follows. For a clear explanation of the differences between lab and field data, refer to lab and field data differences.
Where your site stands against real-world benchmarks
Core Web Vitals global pass rates as of mid-2026
According to May 2026 CrUX data, only 55.9% of origins globally pass all three Core Web Vitals simultaneously (origin-level aggregate). Breaking it down by individual metric: LCP is the hardest with a 68.6% global pass rate, followed by CLS at 81.3% and INP at 86.6%. If your site passes all three today, you’re already ahead of nearly half the web, a meaningful competitive position by any measure. Industry pass-rate studies provide additional context on how pass rates vary by vertical and region, see this Core Web Vitals pass rates analysis for comparisons (Core Web Vitals pass rates).
The mobile performance gap that directly affects your rankings
Desktop and mobile performance diverge significantly. Based on May 2026 CrUX data, approximately 56% of desktop origins pass all three metrics compared to roughly 48% of mobile origins. Since Google ranks based on mobile scores, the mobile pass rate is the benchmark that actually affects your search visibility. WordPress sites lag further still: only about 46% of WordPress mobile sites achieve passing scores across all three metrics.
The gap between mobile and desktop performance is primarily a JavaScript and image optimization problem. Mobile devices have less processing power and often run on slower connections, which amplifies any inefficiency in how a page loads and executes code.
Realistic targets to set for each metric
Rather than chasing the minimum thresholds, set targets that put you ahead of the global average. Aim for LCP at or under 2.0 seconds, INP at or under 150ms, and CLS at or under 0.05. These numbers are genuinely fast by current web standards and place you well above the majority of sites competing in most verticals.
For vertical-specific baselines, ecommerce, news, SaaS, use SpeedCurve’s Industry Benchmarks or query the CrUX dataset via BigQuery with competitor domain names from your category. Generic global averages are a starting point; your actual competitors’ scores are what you need to beat.
Your next step: the Media Indonesia fix guide
What understanding the metrics doesn’t solve
Knowing the thresholds is necessary, but it doesn’t move a single metric. LCP typically won’t improve until you preload your hero image with fetchpriority="high" and convert it to a modern format like WebP or AVIF, a combination that real-world case studies consistently show reduces LCP by meaningful margins. CLS stays high until you add explicit width and height attributes to every image. INP remains sluggish until you defer third-party scripts off the main thread and break up long JavaScript tasks. Diagnosis is one step; the fix is another entirely.
The Media Indonesia Core Web Vitals optimization guide
The technology team at Media Indonesia (mediaindonesia.com/teknologi) has published a step-by-step optimization guide built specifically for developers and marketers moving from “I understand the metrics” to “my scores are green.” It covers prioritized fixes for LCP, CLS, and INP with implementation-level instructions, from image preloading and server response optimization to script deferral and layout reservation for ad slots. You can find it directly at mediaindonesia.com/teknologi.
If you’ve just run your first PageSpeed Insights report and need to act on what you found, that guide is the logical next read. This article tells you what to measure and why it matters. The fix guide tells you exactly what to change.
What to take away
Core Web Vitals, LCP, INP, and CLS, are confirmed ranking signals with clear, measurable thresholds and documented consequences for sites that miss them. They determine not just where you rank in traditional search results, but increasingly whether you appear in AI-generated summaries at all.
Fewer than 56% of sites globally pass all three page performance metrics simultaneously. Reaching that threshold puts you ahead of nearly half the web and ahead of most competitors in any vertical. The competitive advantage is real and quantifiable.
Start by measuring. Run your Core Web Vitals report in Search Console, check your field data in PageSpeed Insights, and compare your numbers against the benchmarks above. Then head to mediaindonesia.com/teknologi for the implementation guide to act on what you find.

